
If you run APIs in Django REST Framework, you eventually need answers that normal application logs do not give you quickly: which endpoint failed, what payload arrived, what status code was returned, how long the request took, whether sensitive data was masked, and whether the same endpoint is getting slower over time. DRF API Logger exists for that exact gap. It adds request and response observability to a DRF project without forcing every view to write custom logging code.
This guide targets the modern v1.2.x line, including the documentation update for v1.2.1. The package is published under the Apache 2.0 license, supports Python 3.6 and newer, and the current documentation highlights request/response logging, sensitive-data masking, database logging, signal-based logging, admin analytics, queue-based background processing, request tracing, content-type controls, and per-request API profiling.
What DRF API Logger Actually Solves
Most Django projects already have server logs, access logs, exception logs, and maybe an APM tool. Those are useful, but they often fail at one very practical workflow: reconstructing a specific API call. DRF API Logger stores the API path, HTTP method, headers, body, response body, status code, execution time, client IP address, timestamp, and optional tracing ID in a structured way.
This makes it useful for four common engineering jobs:
- Debugging: Reproduce what happened when a client says "the API returned the wrong thing".
- Operational monitoring: Find slow endpoints, failed status codes, noisy clients, and regression patterns.
- Audit trails: Keep a structured trail of API activity for internal analysis and compliance workflows.
- Performance diagnosis: Use profiling fields to split total time into middleware, view/serialization, SQL, and business-logic cost.
Where It Fits in a Django REST Framework App
DRF API Logger is installed as Django middleware. That matters because middleware sees the request before the DRF view executes and sees the response after the view returns. The logger can therefore capture both sides of the call without changing every view, serializer, or viewset.
A simplified request lifecycle looks like this:
- The client sends a request to a DRF endpoint.
- The logger middleware records request metadata such as path, method, headers, body, and client IP.
- The DRF view runs normally. Authentication, permissions, throttling, serializer validation, database work, and response generation continue as usual.
- The middleware receives the response and records status code, response body, and execution time.
- The log event is sent to the configured destination: database, signal listeners, or both.
- Database writes are buffered through a queue so normal API response time is not blocked by one insert per request.
When to Use It
Use DRF API Logger when you need structured visibility into DRF request and response behavior, especially when the API team needs to answer production questions without digging through unstructured logs. It is useful for CRUD APIs, internal admin APIs, B2B APIs, mobile app backends, partner integrations, and services where request payloads and status-code patterns matter.
Do not treat it as a full replacement for metrics, distributed tracing, or APM. It complements those systems. Metrics tell you that error rate increased. Tracing tells you which service path was slow. DRF API Logger gives you the concrete DRF request/response record inside your Django app.
Install and Wire It Correctly
Step 1: Install the package:
pip install drf-api-loggerStep 2: Add it to INSTALLED_APPS:
INSTALLED_APPS = [
    # Django apps
    'django.contrib.admin',
    'django.contrib.auth',
    'django.contrib.contenttypes',
    'django.contrib.sessions',
    'django.contrib.messages',
    'django.contrib.staticfiles',

    # Third-party apps
    'rest_framework',
    'drf_api_logger',
]
Step 3: Add the middleware:
MIDDLEWARE = [
    'django.middleware.security.SecurityMiddleware',
    'django.contrib.sessions.middleware.SessionMiddleware',
    'django.middleware.common.CommonMiddleware',
    'django.middleware.csrf.CsrfViewMiddleware',
    'django.contrib.auth.middleware.AuthenticationMiddleware',
    'django.contrib.messages.middleware.MessageMiddleware',
    'django.middleware.clickjacking.XFrameOptionsMiddleware',

    'drf_api_logger.middleware.api_logger_middleware.APILoggerMiddleware',
]
Middleware order depends on what you want captured. In most projects, putting it after Django's common authentication/session middleware is a sensible default because the logger sees normalized Django requests and can still capture the response after DRF finishes.
Step 4: Enable database logging and migrate:
DRF_API_LOGGER_DATABASE = Truepython manage.py migrateThe database table is only useful after migrations are run. If you enable database logging but skip migrations, you should expect missing-table errors or no usable admin records.
Database Logging Deep Dive
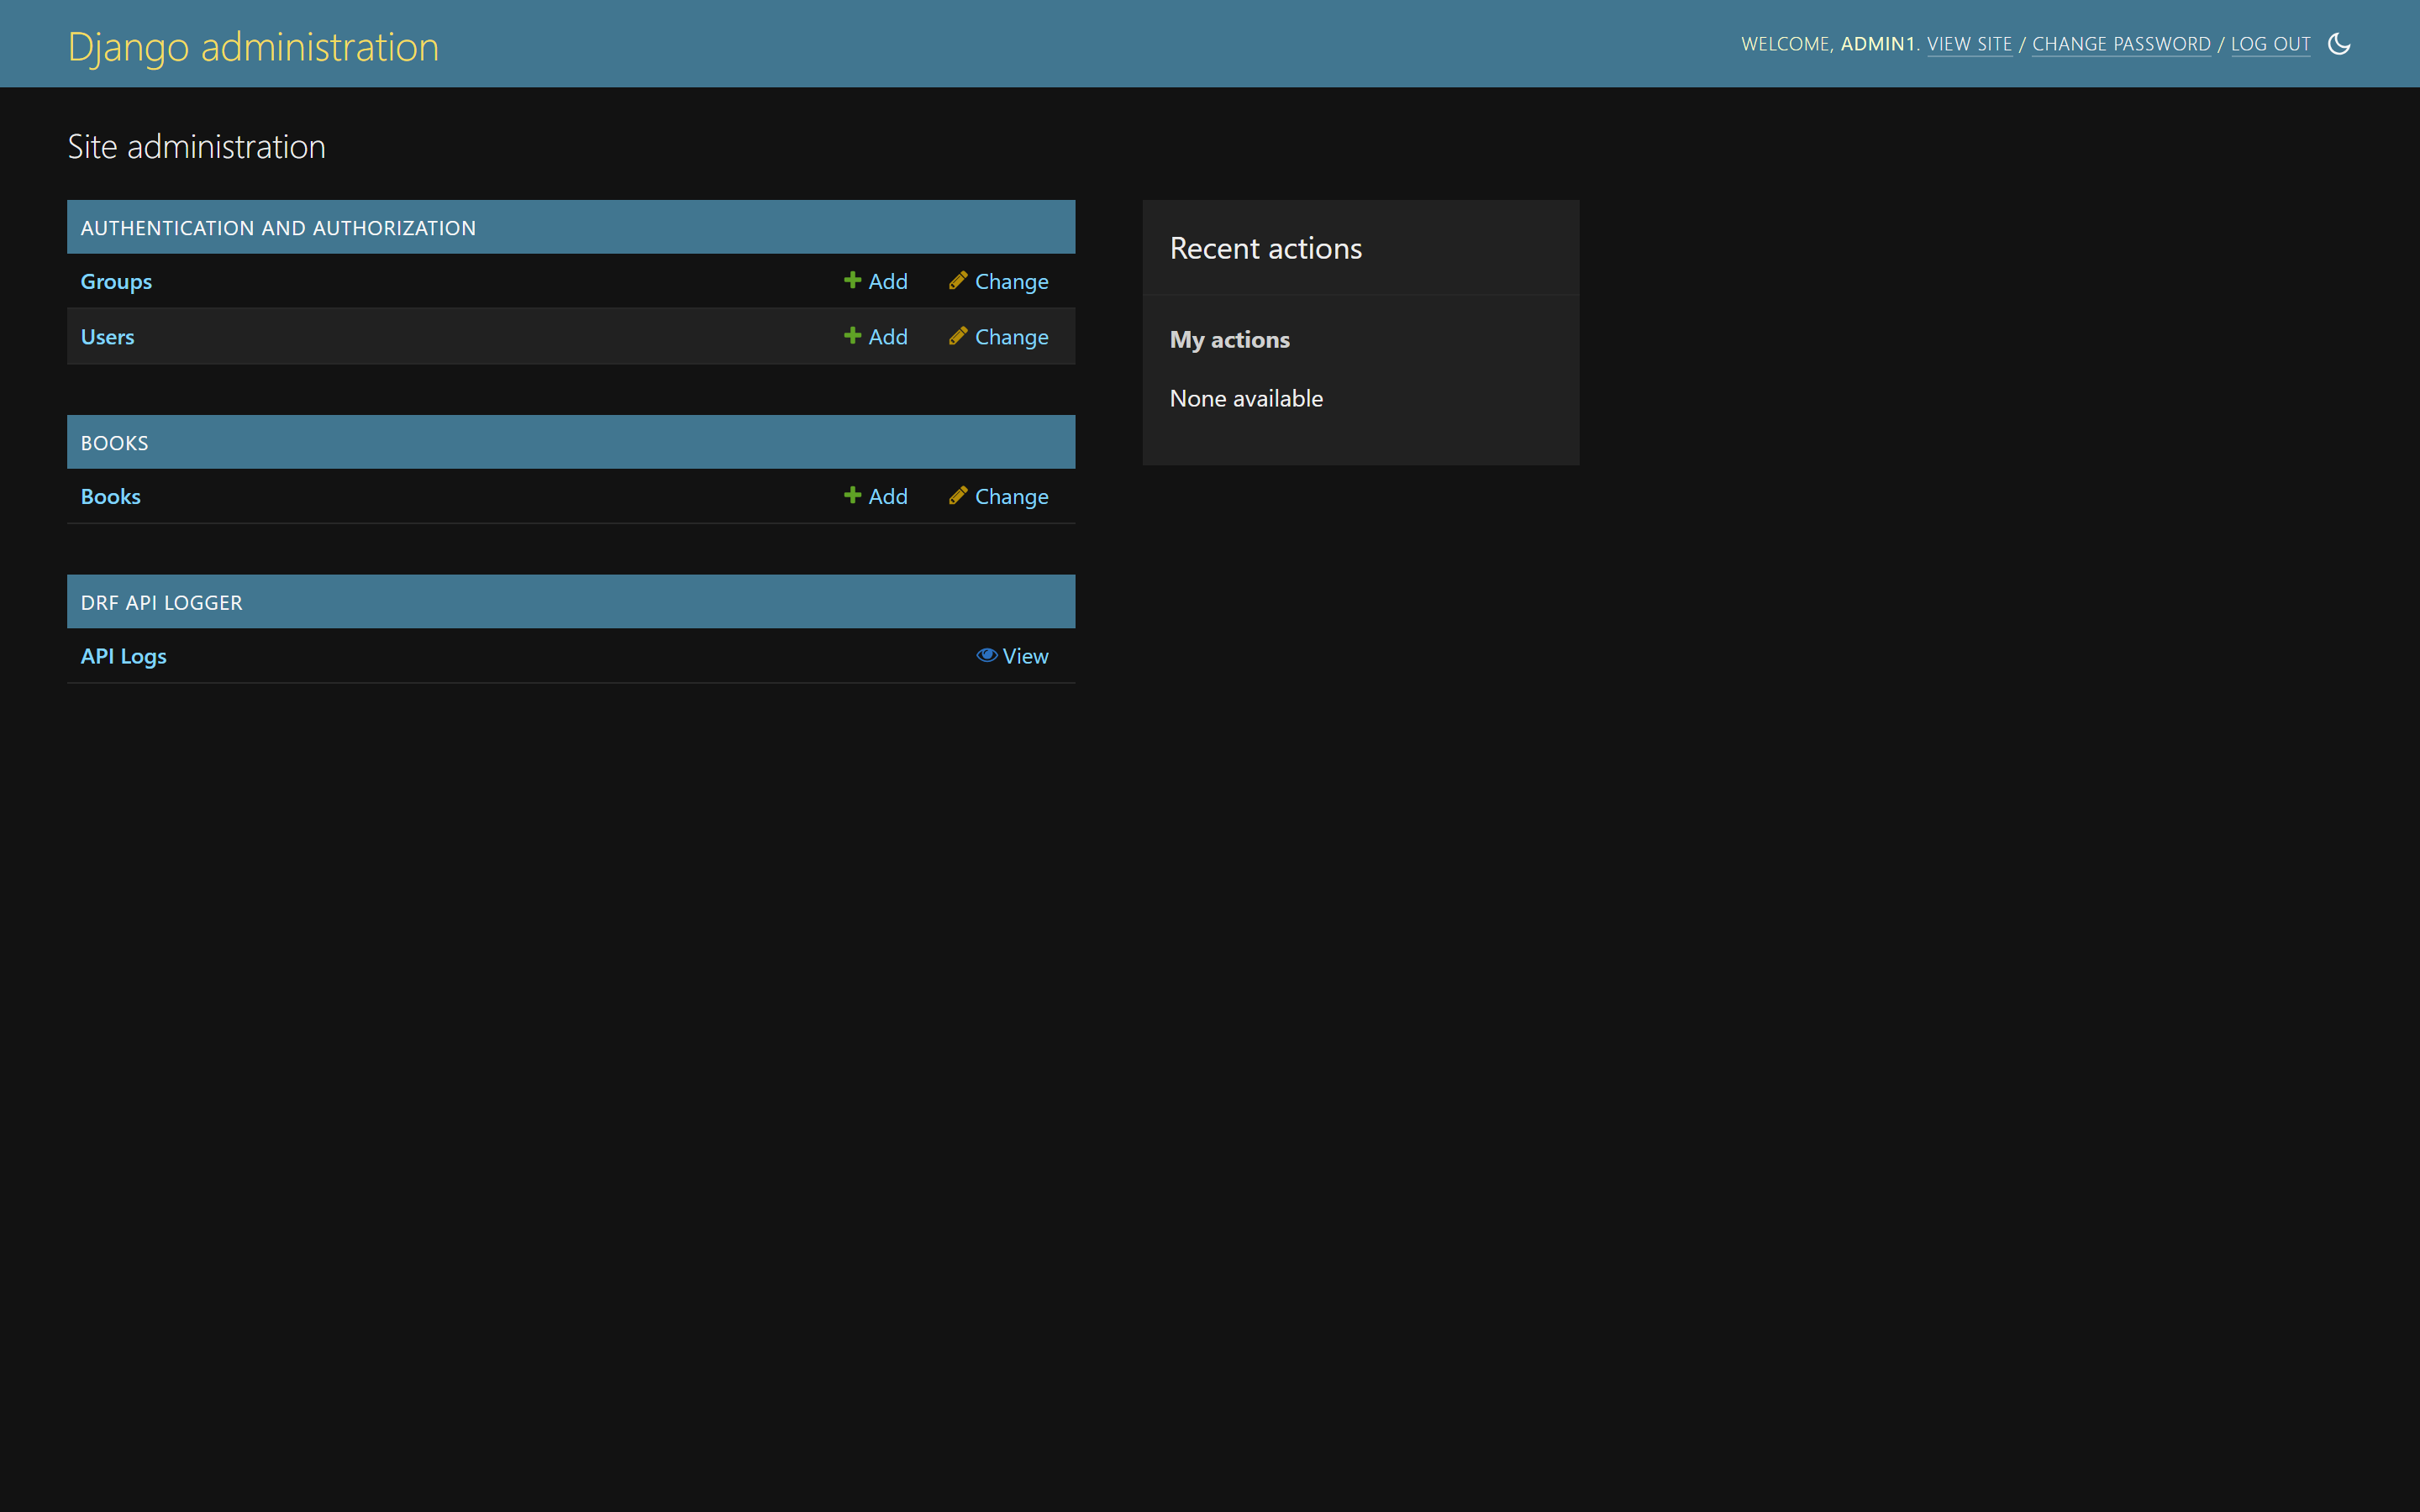
Database logging stores API calls in a Django model and exposes them through the Django admin. This is the easiest mode to start with because it gives your team an immediate UI for searching, filtering, and inspecting API traffic.
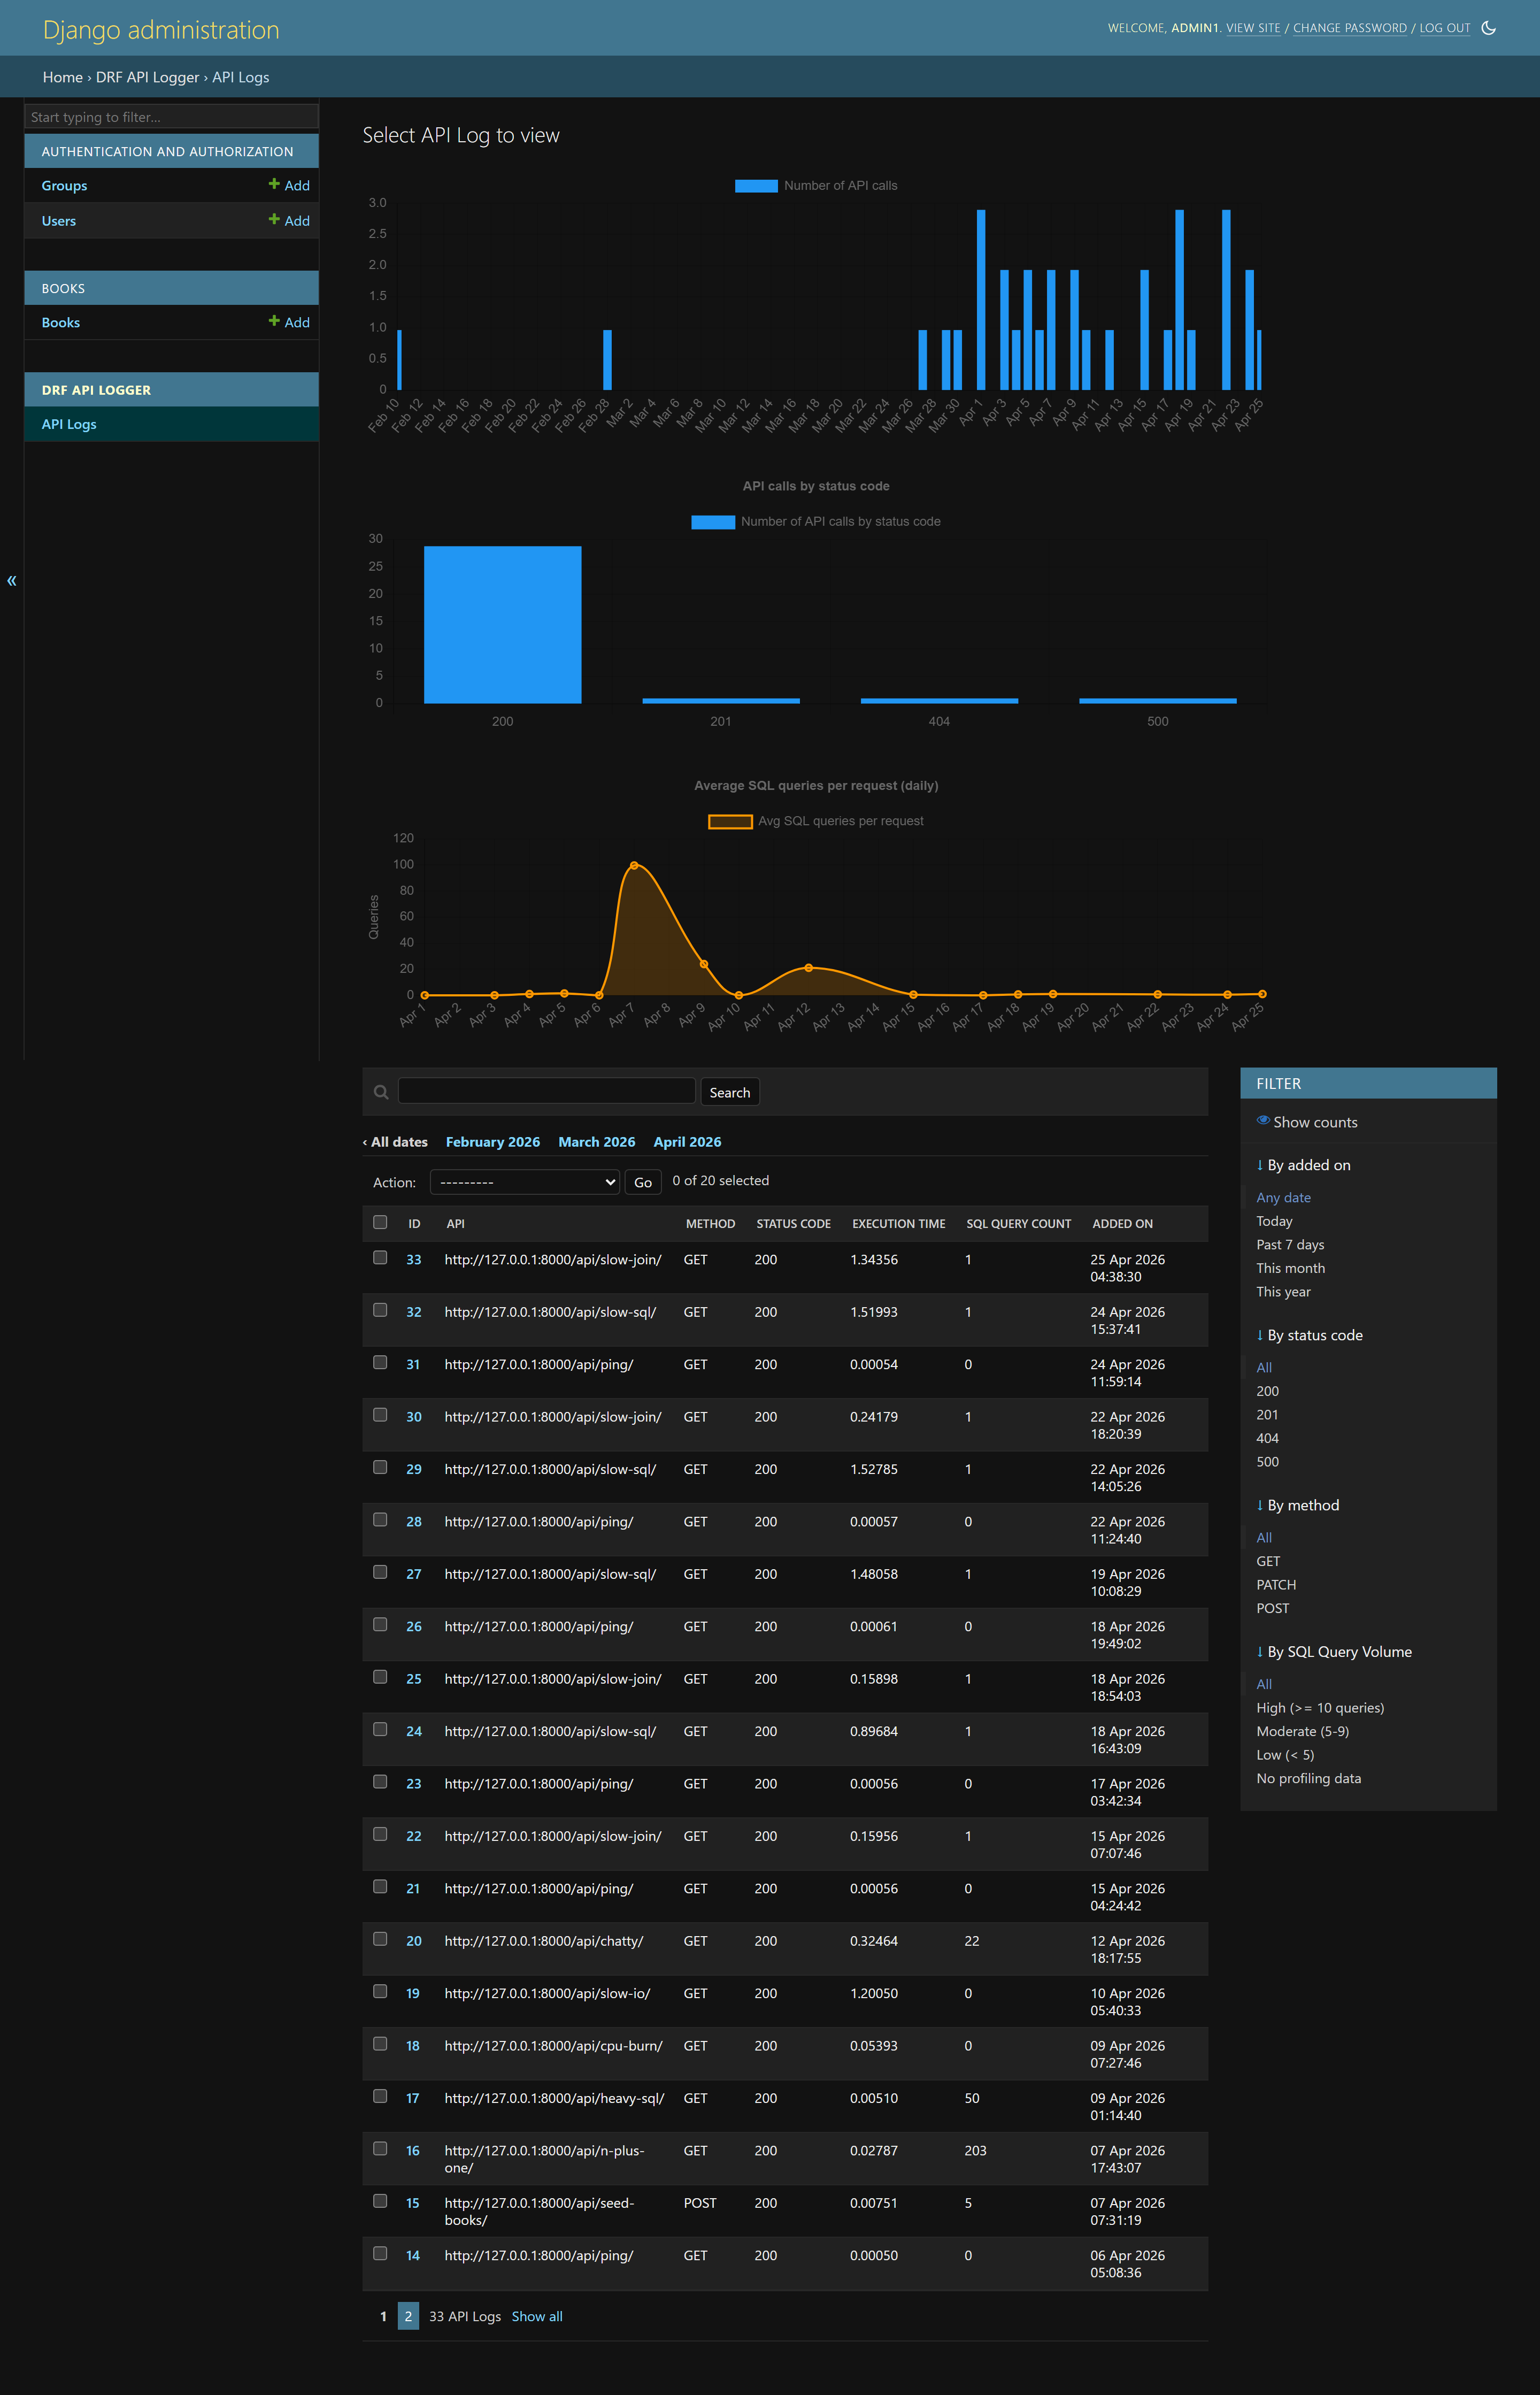
The built-in admin dashboard gives you charts and high-level API activity:
The log listing view gives you a table of API calls with status codes, methods, timings, and request metadata:
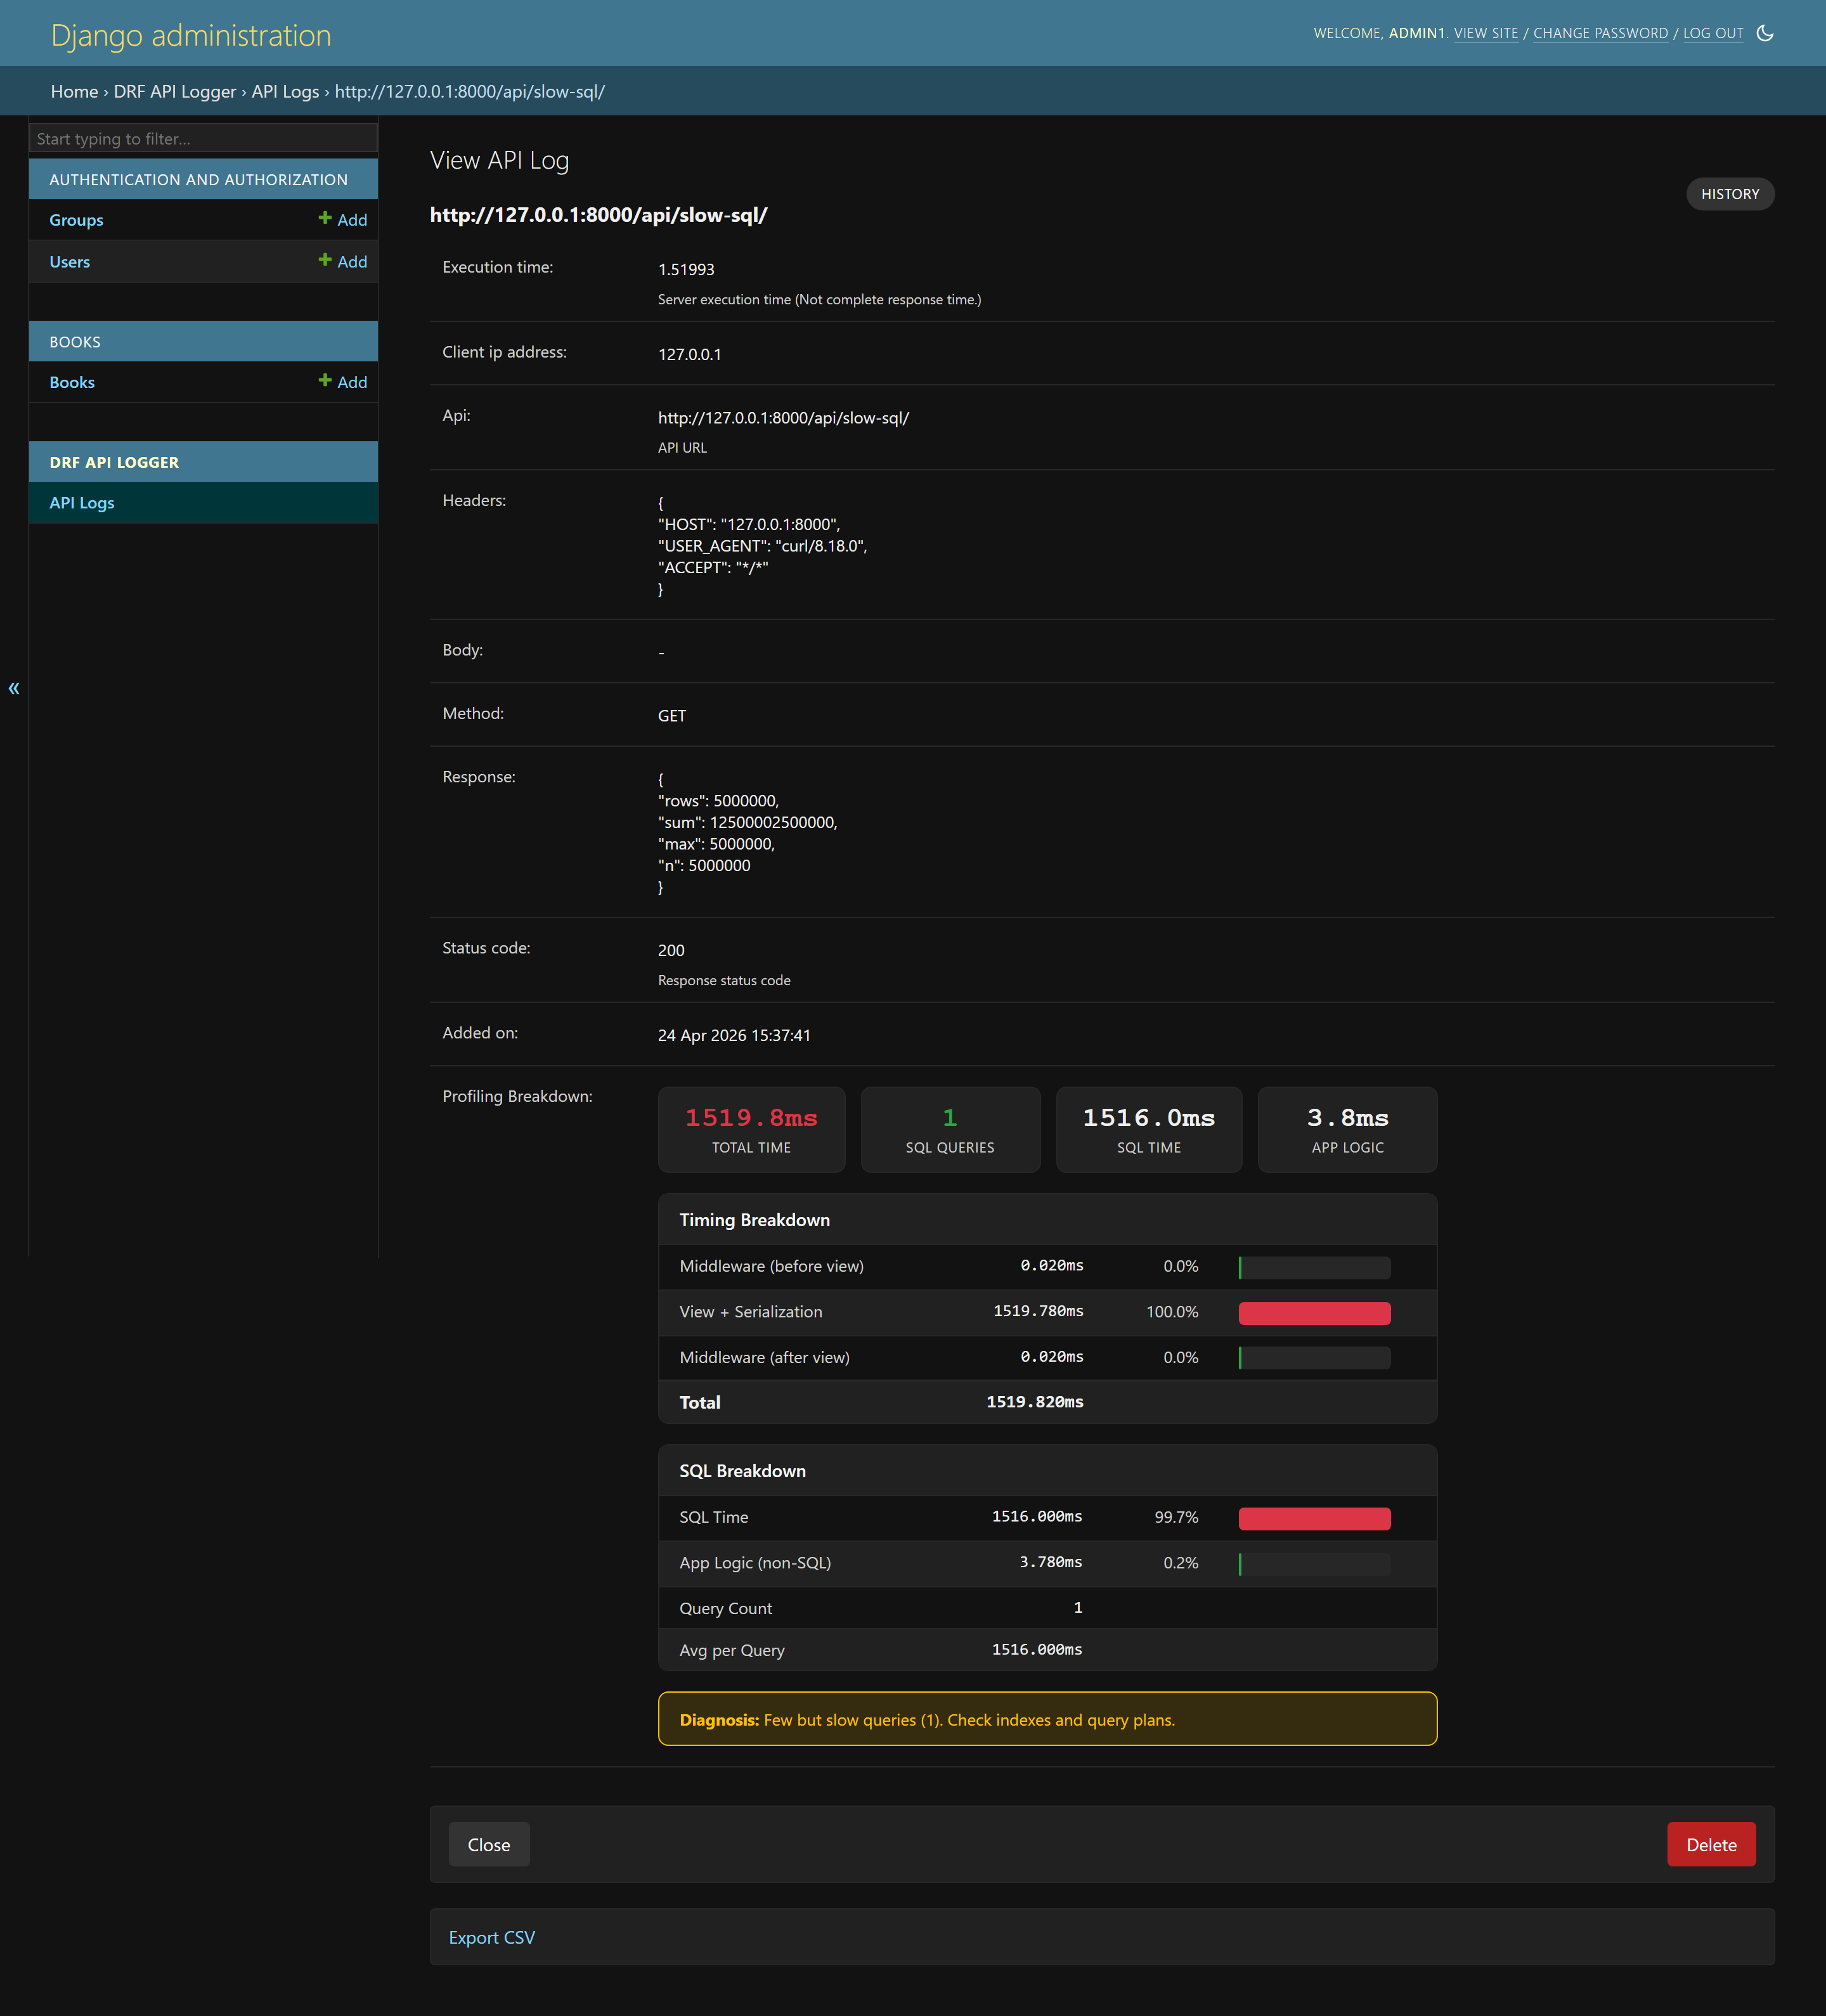
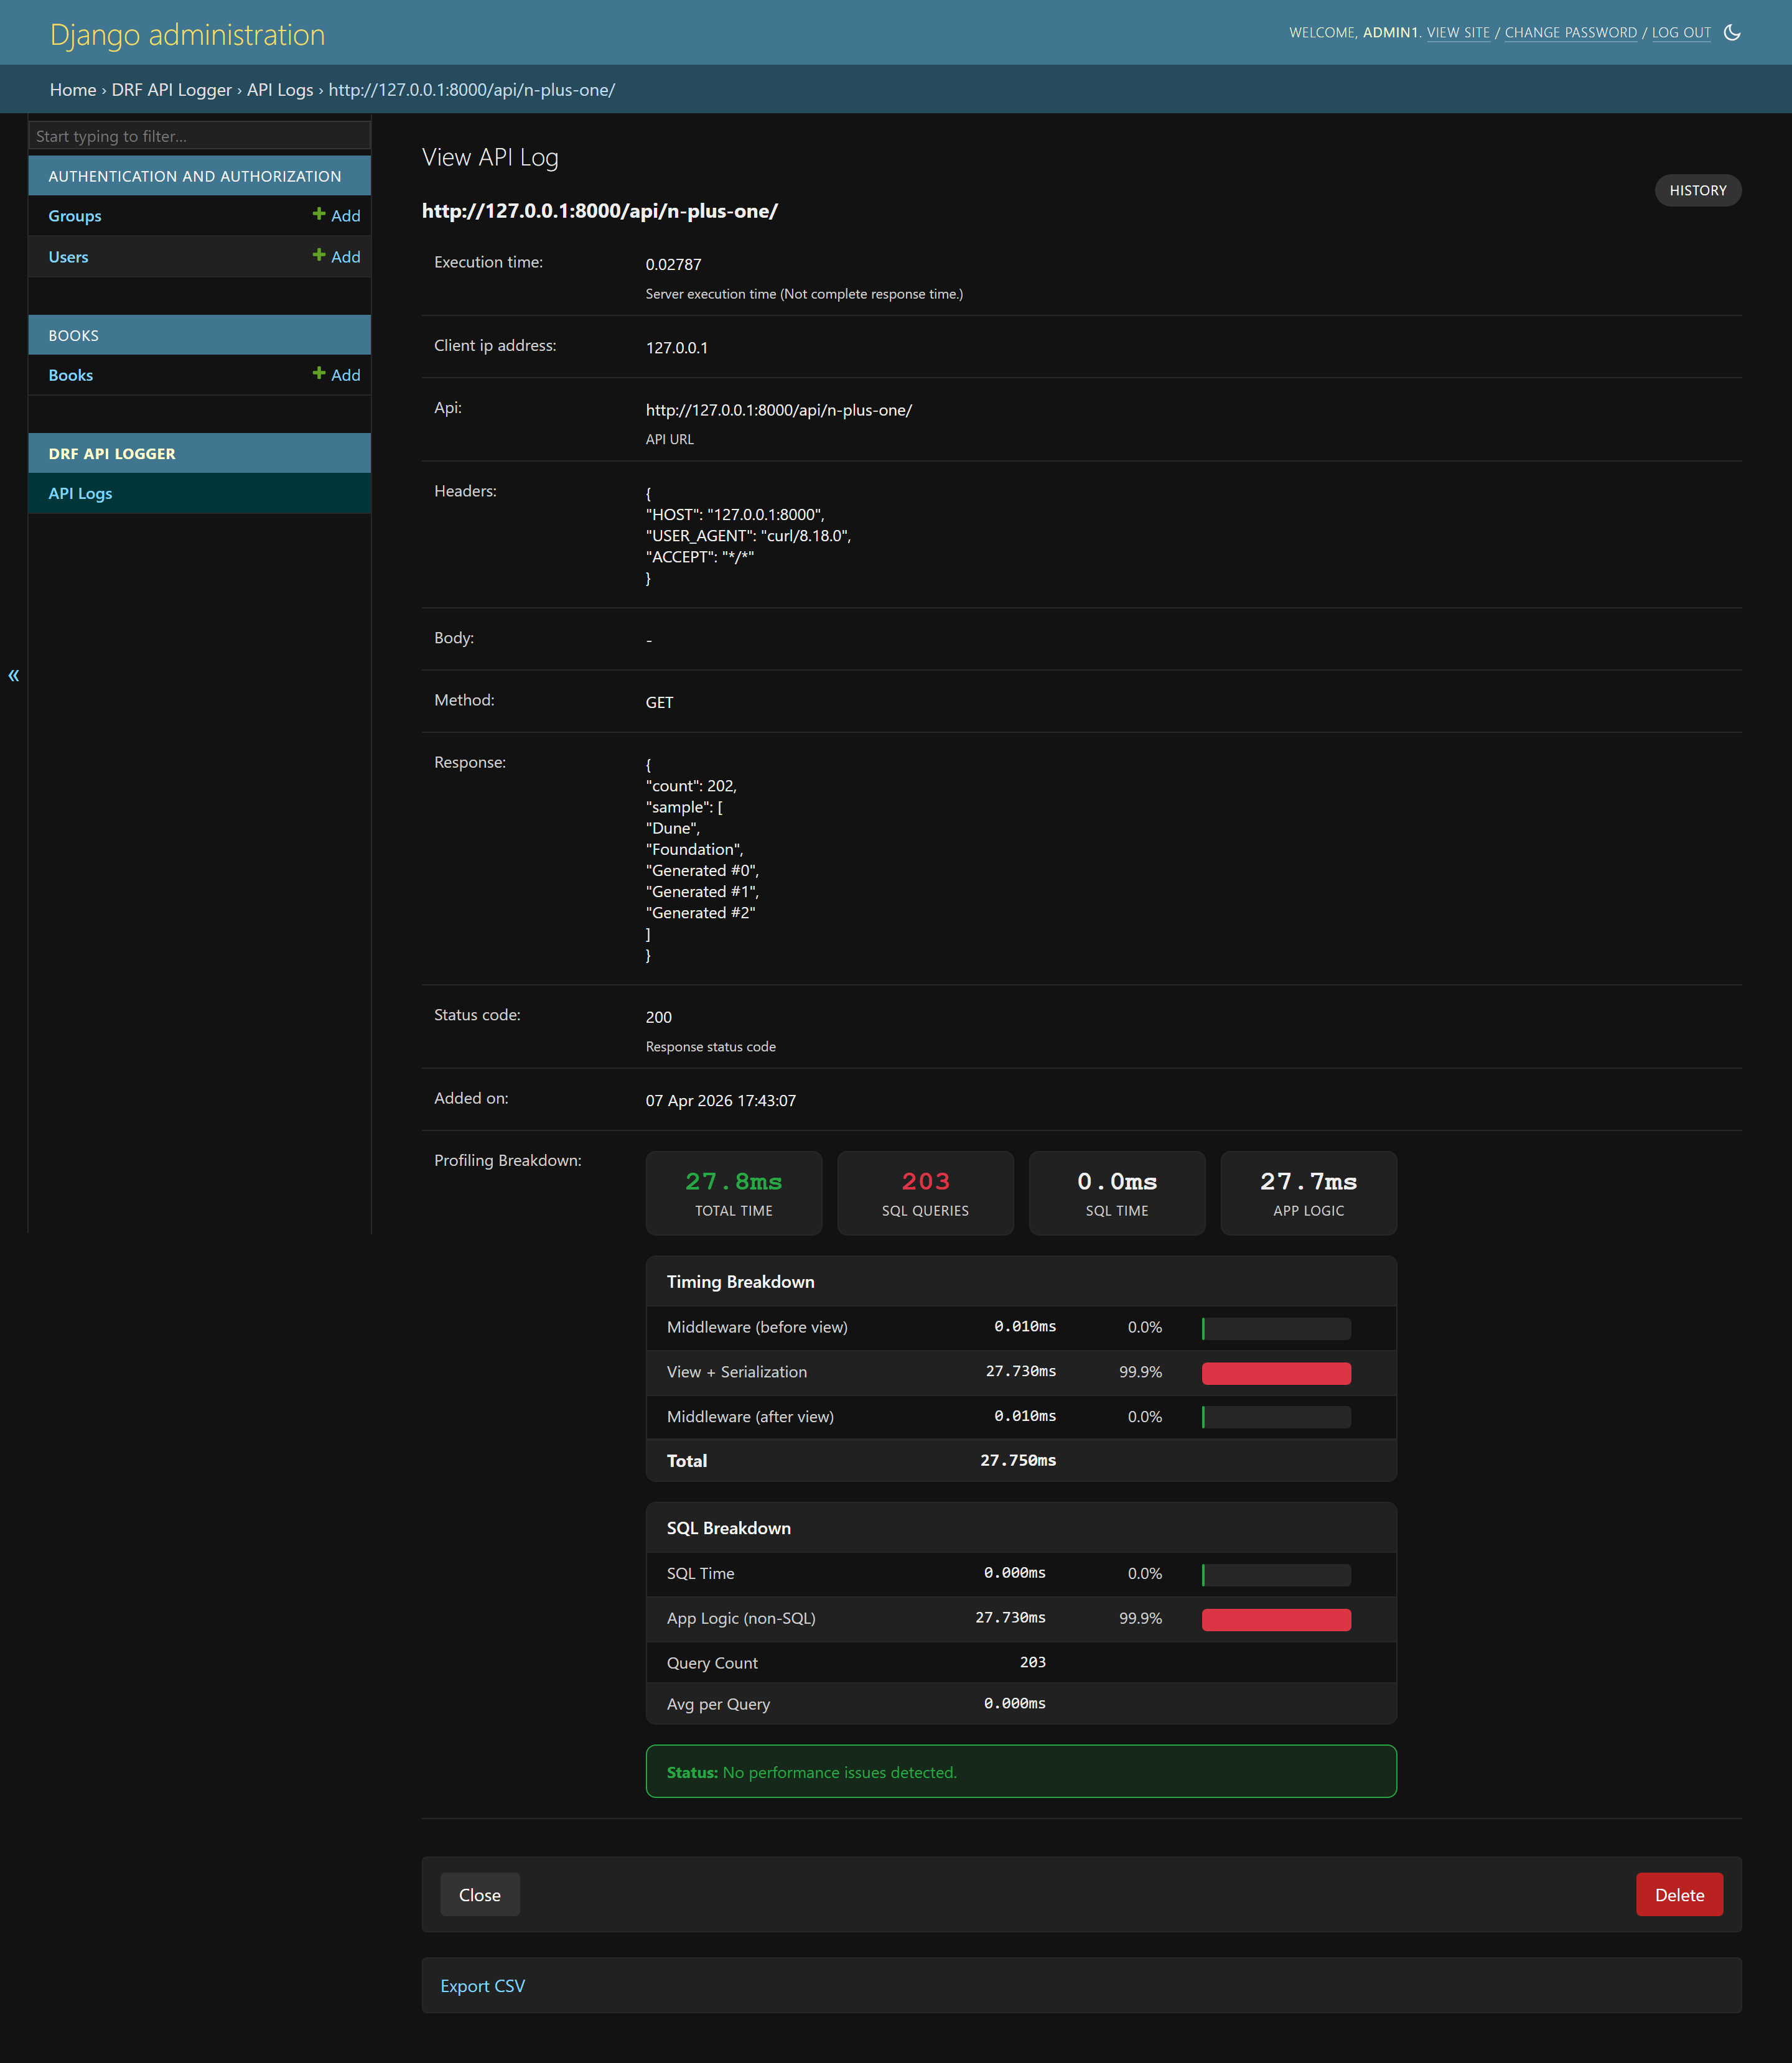
Clicking into a log entry gives you detailed request and response information, including timing and diagnostics:
Sensitive values can be masked before storage, so fields like passwords and tokens do not appear as raw values:
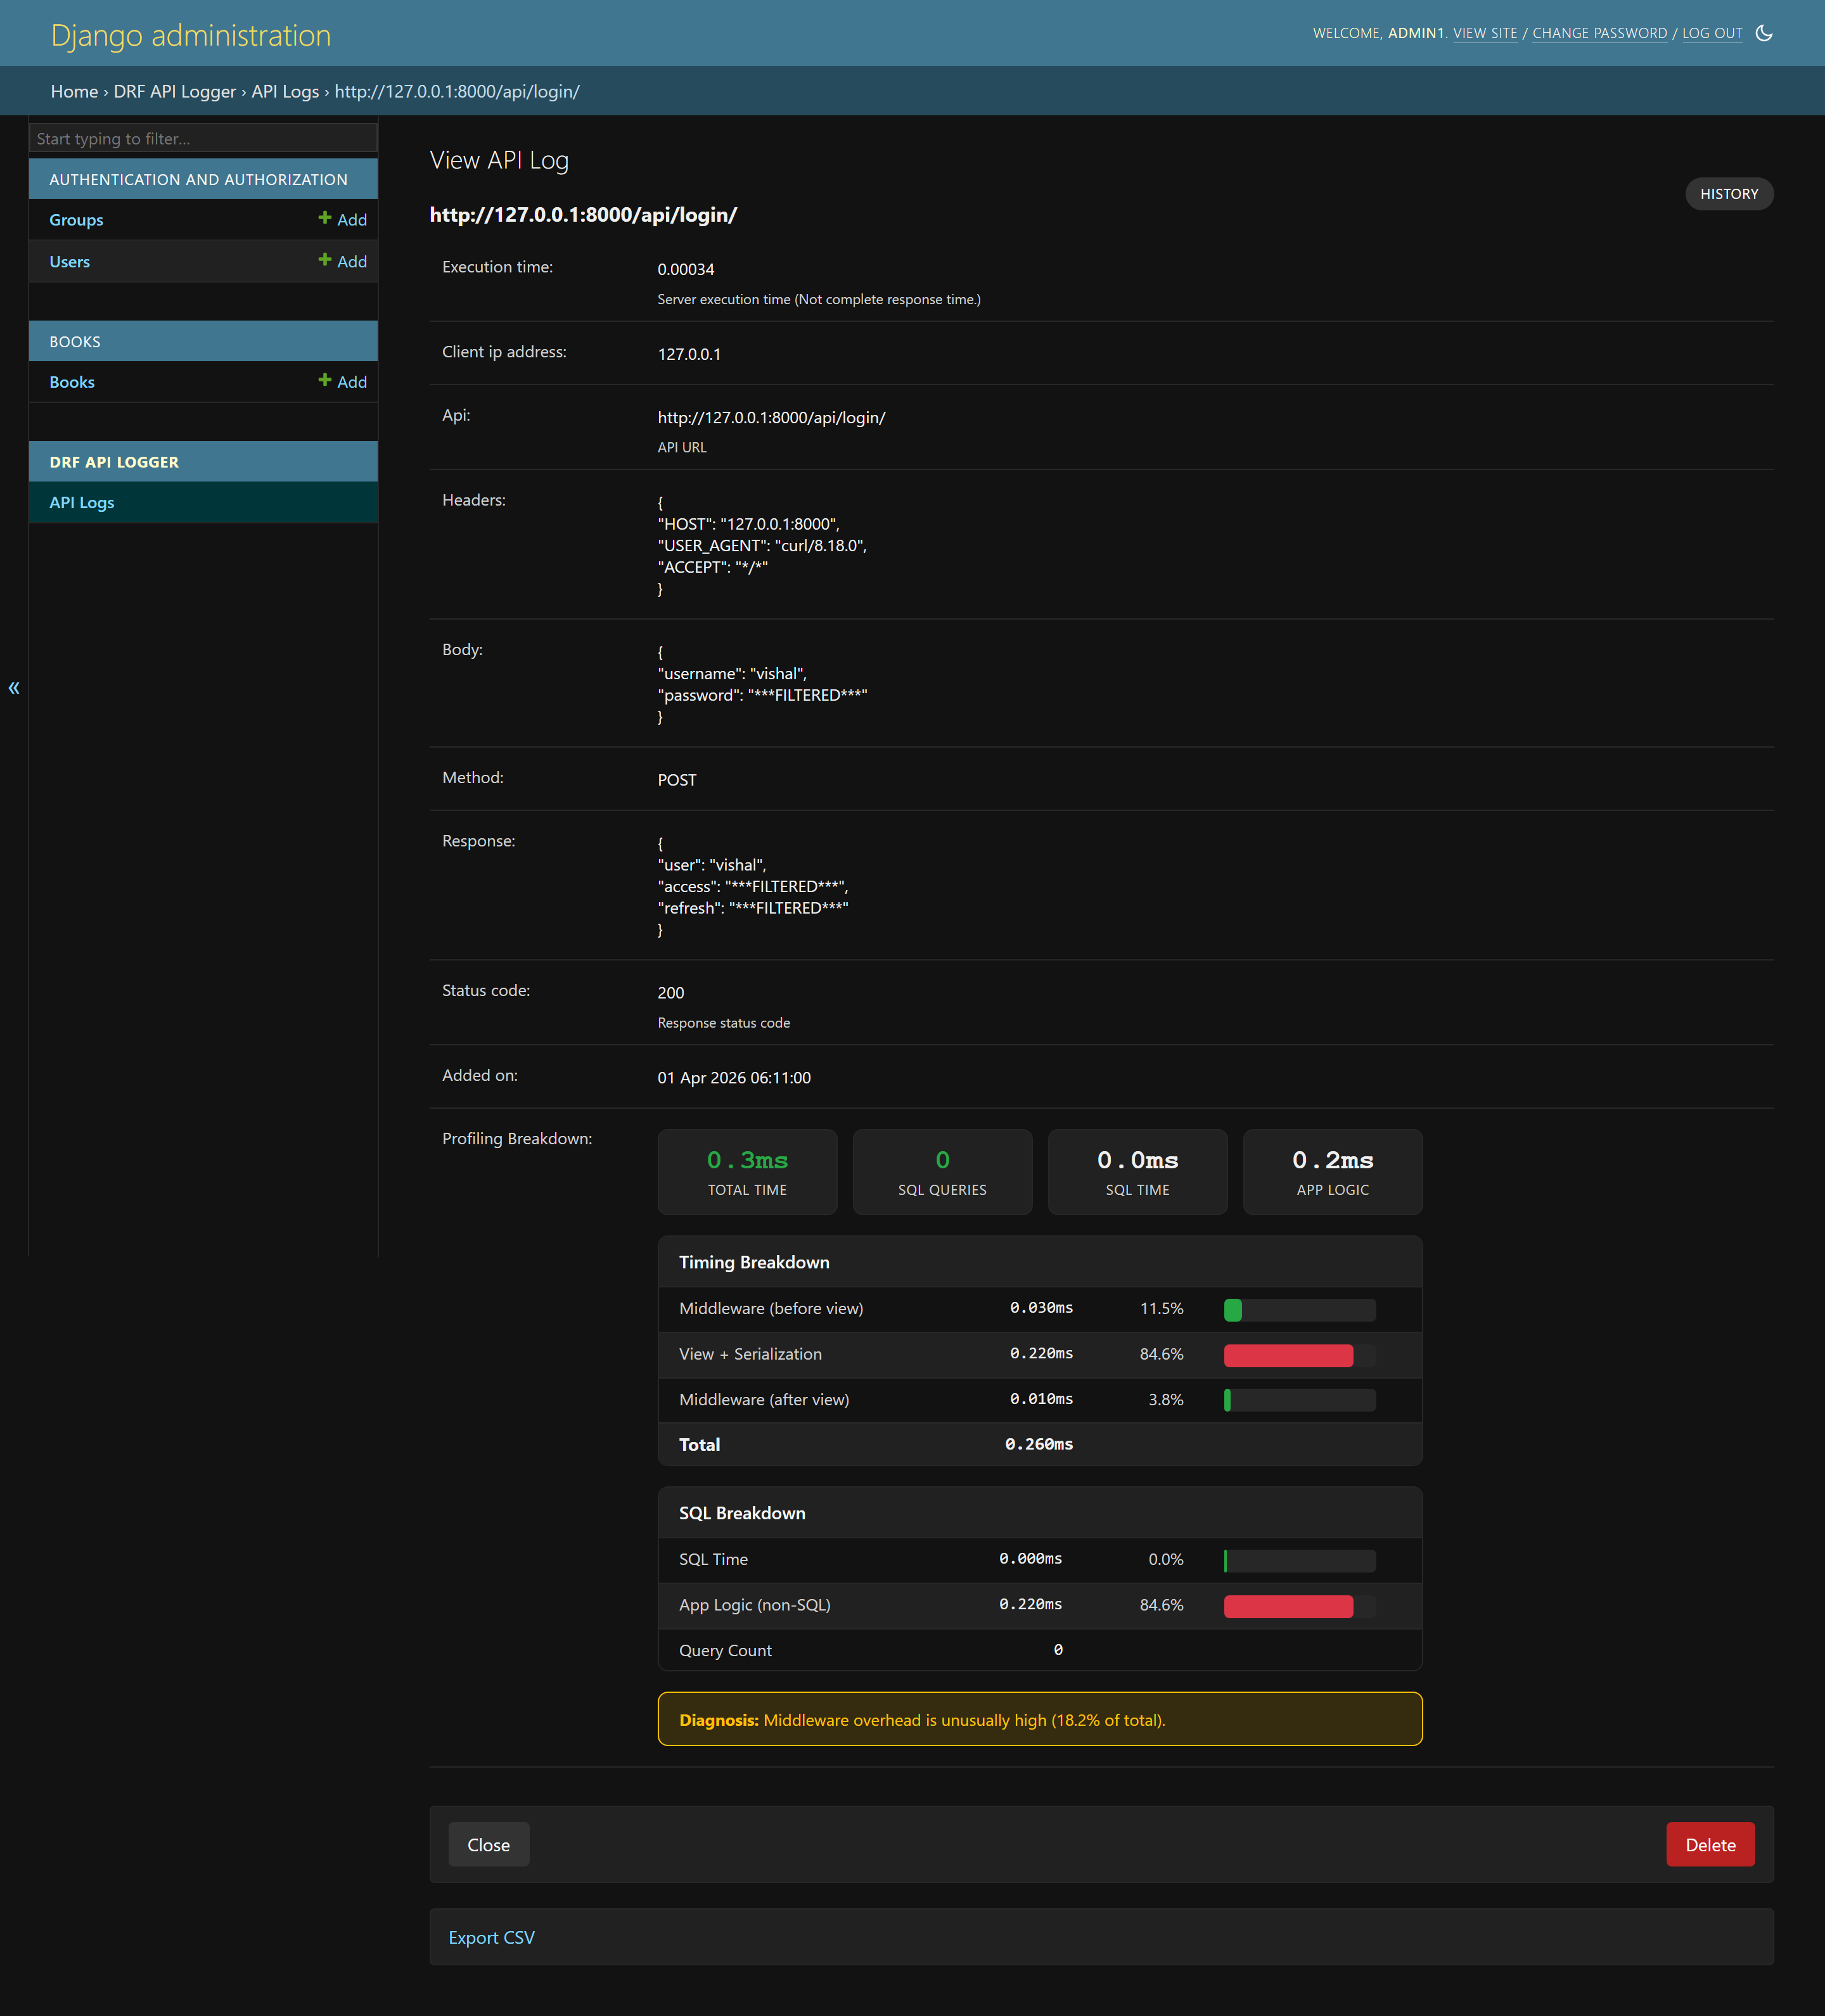
Profiling views make slow endpoints easier to reason about because the problem is split into query count, SQL time, middleware time, and application time:
Model Fields You Should Understand
The core log model stores the operational fields you usually need during debugging:
class APILogsModel(models.Model):
    id = models.BigAutoField(primary_key=True)
    api = models.CharField(max_length=1024)
    headers = models.TextField()
    body = models.TextField()
    method = models.CharField(max_length=10, db_index=True)
    client_ip_address = models.CharField(max_length=50)
    response = models.TextField()
    status_code = models.PositiveSmallIntegerField(db_index=True)
    execution_time = models.DecimalField(decimal_places=5, max_digits=8)
    added_on = models.DateTimeField()

    # Present when API profiling is enabled
    profiling_data = models.TextField(null=True)
    sql_query_count = models.PositiveIntegerField(null=True)
The important operational detail is that execution_time is server-side execution time, not the user's complete network round trip. That makes it useful for backend diagnosis because it removes client network conditions from the number.
Signal-Based Logging Deep Dive
Signal-based logging is for teams that do not want every API log stored only in the application database. When enabled, DRF API Logger emits a signal for every API call. Your listeners can write JSON lines, ship events to a log pipeline, publish to Kafka, trigger a Slack alert, or attach application-specific labels.
DRF_API_LOGGER_SIGNAL = Truefrom drf_api_logger import API_LOGGER_SIGNAL
def write_jsonl(**kwargs):
import json
with open('/var/log/myapp/api-logs.jsonl', 'a') as file_obj:
file_obj.write(json.dumps(kwargs, default=str) + '\n')
def alert_on_server_errors(**kwargs):
if kwargs.get('status_code', 200) >= 500:
notify_ops_team(
api=kwargs.get('api'),
method=kwargs.get('method'),
status=kwargs.get('status_code'),
took=kwargs.get('execution_time'),
trace=kwargs.get('tracing_id'),
)
API_LOGGER_SIGNAL.listen += write_jsonl
API_LOGGER_SIGNAL.listen += alert_on_server_errorsYou can also unsubscribe listeners when needed:
API_LOGGER_SIGNAL.listen -= write_jsonlWhat the Signal Payload Looks Like
The signal payload contains the same kind of data you need for external observability pipelines:
{
    'api': '/api/users/',
    'method': 'POST',
    'status_code': 201,
    'headers': '{"Content-Type": "application/json"}',
    'body': '{"username": "john", "password": "***FILTERED***"}',
    'response': '{"id": 1, "username": "john"}',
    'client_ip_address': '192.168.1.100',
    'execution_time': 0.142,
    'added_on': datetime.now(),
    'tracing_id': 'uuid4-string'
}
This makes signal mode useful when your main log storage is not Django admin. For example, you can keep a short retention window in the database for support/debugging and send the full stream to a centralized log system for longer retention.
API Profiling in v1.2.x
The most important modern capability to explain is API profiling. When profiling is enabled, each logged request can include a timing breakdown instead of only a single total duration. That lets you answer better questions:
- Was the request slow because of SQL?
- Was it slow because the serializer did too much work?
- Was middleware adding unexpected overhead?
- Did the endpoint run many queries and look like an N+1 problem?
- Was total time high even though SQL time was low, pointing to external calls or business logic?
DRF_API_LOGGER_ENABLE_PROFILING = True
DRF_API_LOGGER_PROFILING_SQL_TRACKING = True
When enabled, the profiling data can include middleware time, view and serialization time, SQL time, SQL query count, and diagnosis hints. The package documentation describes patterns such as SQL taking more than 70 percent of total time with high query count as likely N+1 behavior, while low SQL time with high total time suggests business logic or external service latency.
Configuration Reference by Use Case
A large config block is hard to reason about, so treat settings by the problem they solve.
Core Destination Settings
DRF_API_LOGGER_DATABASE = True
DRF_API_LOGGER_SIGNAL = False
Use database mode for admin search and debugging. Use signal mode when your organization already has centralized logging. Use both when you want a short local debugging window plus a durable external log stream.
Queue and Background Processing
DRF_LOGGER_QUEUE_MAX_SIZE = 50
DRF_LOGGER_INTERVAL = 10
The queue controls how often logs are flushed. Larger queues reduce write frequency but can increase memory usage and delay visibility. Shorter intervals make logs visible faster but write more frequently. For high-traffic systems, tune both with real production traffic instead of guessing.
Selective Logging
DRF_API_LOGGER_SKIP_NAMESPACE = ['admin', 'internal']
DRF_API_LOGGER_SKIP_URL_NAME = ['health-check', 'metrics']
DRF_API_LOGGER_METHODS = ['GET', 'POST', 'PUT', 'PATCH', 'DELETE']
DRF_API_LOGGER_STATUS_CODES = [200, 201, 400, 401, 403, 404, 500]
Selective logging is how you keep the signal-to-noise ratio healthy. Do not store health checks, metrics endpoints, noisy internal probes, or endpoints that generate data you are not allowed to retain.
Sensitive Data and Payload Limits
DRF_API_LOGGER_EXCLUDE_KEYS = [
    'password',
    'token',
    'access',
    'refresh',
    'secret',
    'api_key',
    'authorization',
]

DRF_API_LOGGER_MAX_REQUEST_BODY_SIZE = 1024
DRF_API_LOGGER_MAX_RESPONSE_BODY_SIZE = 2048
Masking protects common secret fields. Body size limits protect your database. A single huge response body can consume more storage than thousands of normal API calls, so set limits before using the logger on high-volume production endpoints.
Supported Content Types
DRF_API_LOGGER_CONTENT_TYPES = [
    'application/json',
    'application/vnd.api+json',
    'application/xml',
    'text/csv',
]
By default, JSON APIs are the primary use case. The package also supports custom content types, including vendor JSON media types such as JSON:API style content types.
Tracing and Correlation IDs
DRF_API_LOGGER_ENABLE_TRACING = True
DRF_API_LOGGER_TRACING_ID_HEADER_NAME = 'X-Trace-ID'
DRF_API_LOGGER_TRACING_FUNC = 'myapp.tracing.generate_trace_id'
Tracing IDs matter when an API request crosses systems. If your gateway already sends a trace header, configure the header name so DRF API Logger stores the upstream correlation ID instead of inventing an unrelated one. In your views, you can access request.tracing_id when tracing is enabled.
Path Storage Format
DRF_API_LOGGER_PATH_TYPE = 'ABSOLUTE'
# Other options: FULL_PATH, RAW_URI
ABSOLUTE stores the full absolute URI using Django's normal host validation. FULL_PATH stores only path and query string. RAW_URI can bypass normal host validation behavior, so use it only when you understand the security implications.
Querying Logs with the Django ORM
Once database logging is enabled, API logs become queryable with normal Django ORM patterns.
from datetime import timedelta
from django.db.models import Avg, Count, Max
from django.utils import timezone
from drf_api_logger.models import APILogsModel

since = timezone.now() - timedelta(hours=24)

# Recent failed API calls
errors = APILogsModel.objects.filter(
    added_on__gte=since,
    status_code__gte=400,
).order_by('-added_on')

# Slowest endpoints
slowest = APILogsModel.objects.filter(
    added_on__gte=since,
).order_by('-execution_time')[:20]

# Endpoint error rates
endpoint_summary = (
    APILogsModel.objects
    .filter(added_on__gte=since)
    .values('api', 'method')
    .annotate(
        calls=Count('id'),
        avg_ms=Avg('execution_time'),
        max_ms=Max('execution_time'),
    )
    .order_by('-calls')
)
Retention and Cleanup
API logs grow forever unless you intentionally delete or archive them. Decide retention before enabling database logging in production. For many teams, 7 to 30 days in the application database is enough for support and debugging, while longer retention belongs in cheaper log storage.
from datetime import timedelta
from django.core.management.base import BaseCommand
from django.utils import timezone
from drf_api_logger.models import APILogsModel

class Command(BaseCommand):
    help = 'Delete old DRF API Logger records'

    def handle(self, *args, **options):
        cutoff = timezone.now() - timedelta(days=30)
        deleted, _ = APILogsModel.objects.filter(
            added_on__lt=cutoff,
        ).delete()
        self.stdout.write(f'Deleted {deleted} old API log rows')
Production Database Design
For small applications, storing logs in the default database may be acceptable. For high-traffic systems, use a dedicated logging database so API log writes and log searches do not compete with customer-facing transactional data.
DRF_API_LOGGER_DEFAULT_DATABASE = 'logs_db'Then configure a Django database router or run migrations against the chosen database, depending on how your project handles multiple databases.
Add indexes based on your real query patterns. Common examples:
CREATE INDEX idx_api_logs_added_on
ON drf_api_logs(added_on);

CREATE INDEX idx_api_logs_api_method
ON drf_api_logs(api, method);

CREATE INDEX idx_api_logs_status_added_on
ON drf_api_logs(status_code, added_on);
Security and Privacy Checklist
API logging is powerful, but it can become a liability if you log the wrong data. Treat API logs as sensitive production data.
- Mask secrets: Add every credential-like key to
DRF_API_LOGGER_EXCLUDE_KEYS. - Limit payload size: Use max request and response body settings before enabling production logging.
- Skip sensitive endpoints: Do not log endpoints that process card data, tokens, secret exports, or regulated data unless you have a clear retention policy.
- Restrict admin access: Only trusted operators should see request and response logs.
- Set retention: Delete or archive old rows automatically.
- Use a separate database: Keep logs away from the primary write path for busy systems.
- Review compliance requirements: GDPR, HIPAA, PCI, SOC 2, and internal policies may restrict what you can store.
Troubleshooting: No Logs Showing Up
If you installed the package but do not see logs, check these in order:
- Middleware is missing: Confirm
APILoggerMiddlewareis inMIDDLEWARE. - Database logging is disabled: Set
DRF_API_LOGGER_DATABASE = True. - Migrations were not run: Run
python manage.py migrate. - Endpoint is skipped: Review skip namespace, skip URL name, method filters, and status-code filters.
- Content type is not logged: Add your API media type to
DRF_API_LOGGER_CONTENT_TYPES. - Admin endpoint confusion: Django admin panel requests are excluded from logging.
- Wrong database: If using
DRF_API_LOGGER_DEFAULT_DATABASE, migrate and query the correct database.
Troubleshooting: Logs Are Too Large
Large log growth usually comes from response bodies, high-volume endpoints, or long retention. Fix the data volume at the source:
- Set
DRF_API_LOGGER_MAX_REQUEST_BODY_SIZEandDRF_API_LOGGER_MAX_RESPONSE_BODY_SIZE. - Skip health checks, polling endpoints, metrics endpoints, and noisy internal routes.
- Use status-code filtering if you only need failures.
- Archive or delete rows older than your operational retention window.
- Move long-term logs to cheaper storage through signal listeners.
Troubleshooting: Slow Admin Search
If the admin log table becomes slow, the logger is doing its job but the storage strategy needs tuning. Add indexes, filter by date first, avoid retaining unlimited logs, and consider a separate logging database. Search over giant request and response bodies is inherently expensive, so do not keep unnecessary payloads forever.
DRF API Logger vs Plain Django Logging
Plain Django logging is still useful for application events, exceptions, and custom log statements. DRF API Logger is different because it captures structured API request/response records automatically. The difference is not "which one is better"; the difference is what question you are answering.
- Use Django logging for application events, error traces, startup issues, and custom domain events.
- Use DRF API Logger for API-level request/response records, status-code analysis, slow endpoint diagnosis, and support debugging.
- Use APM/tracing for cross-service timing and distributed request paths.
Practical Production Setup
For a serious production API, start with a conservative configuration:
DRF_API_LOGGER_DATABASE = True
DRF_API_LOGGER_SIGNAL = True

DRF_LOGGER_QUEUE_MAX_SIZE = 100
DRF_LOGGER_INTERVAL = 5

DRF_API_LOGGER_SKIP_URL_NAME = ['health-check', 'metrics']
DRF_API_LOGGER_STATUS_CODES = [400, 401, 403, 404, 409, 422, 429, 500, 502, 503]

DRF_API_LOGGER_EXCLUDE_KEYS = [
    'password',
    'token',
    'access',
    'refresh',
    'secret',
    'api_key',
    'authorization',
]

DRF_API_LOGGER_MAX_REQUEST_BODY_SIZE = 2048
DRF_API_LOGGER_MAX_RESPONSE_BODY_SIZE = 4096

DRF_API_LOGGER_SLOW_API_ABOVE = 200
DRF_API_LOGGER_ENABLE_TRACING = True
DRF_API_LOGGER_TRACING_ID_HEADER_NAME = 'X-Trace-ID'

# Enable profiling first in staging or selectively in production.
DRF_API_LOGGER_ENABLE_PROFILING = True
DRF_API_LOGGER_PROFILING_SQL_TRACKING = True
This example logs failures and slow behavior aggressively, masks sensitive fields, limits payload growth, and keeps traceability. You can widen or narrow it based on your compliance and debugging needs.
What to Monitor After Enabling It
- Log table growth: Rows per day, storage size, and index size.
- Queue behavior: Whether logs flush regularly under normal and peak traffic.
- Slow endpoint count: Endpoints crossing your configured threshold.
- Error bursts: Sudden increases in 4xx or 5xx responses.
- Payload size: Whether large request or response bodies are being stored.
- Admin query speed: Whether support engineers can search logs quickly.
FAQ
Does DRF API Logger affect API response time?
The package is designed around queue-based background processing so log writes do not sit directly on the API response path. You should still monitor memory, queue settings, and database write behavior under real traffic.
Can I use database logging and signal logging together?
Yes. Database logging gives you a convenient admin interface, while signal logging lets you ship the same event stream to external systems.
Should I log every endpoint?
Not always. Skip health checks, metrics endpoints, high-frequency polling routes, and endpoints that carry data you should not retain.
Is profiling safe in production?
Profiling is useful, but treat it as an operational feature to validate under your workload. SQL tracking can add overhead in some environments, so enable it deliberately and monitor impact.
Can it replace Datadog, Prometheus, OpenTelemetry, or Sentry?
No. It solves a different layer of the observability problem. Use it for structured DRF API logs. Use metrics, traces, and error tracking for broader system visibility.
Reference Links
Final Recommendation
DRF API Logger is a practical way to add API-level observability to Django REST Framework without rewriting views. Start with database logging in a staging environment, confirm that masking and body limits are correct, tune the queue, then enable the production paths you actually need. For higher-traffic systems, route logs to a dedicated database or an external pipeline and keep retention intentionally short.